Projects
We work on a variety of visualisation and data integration projects in different fields of application:
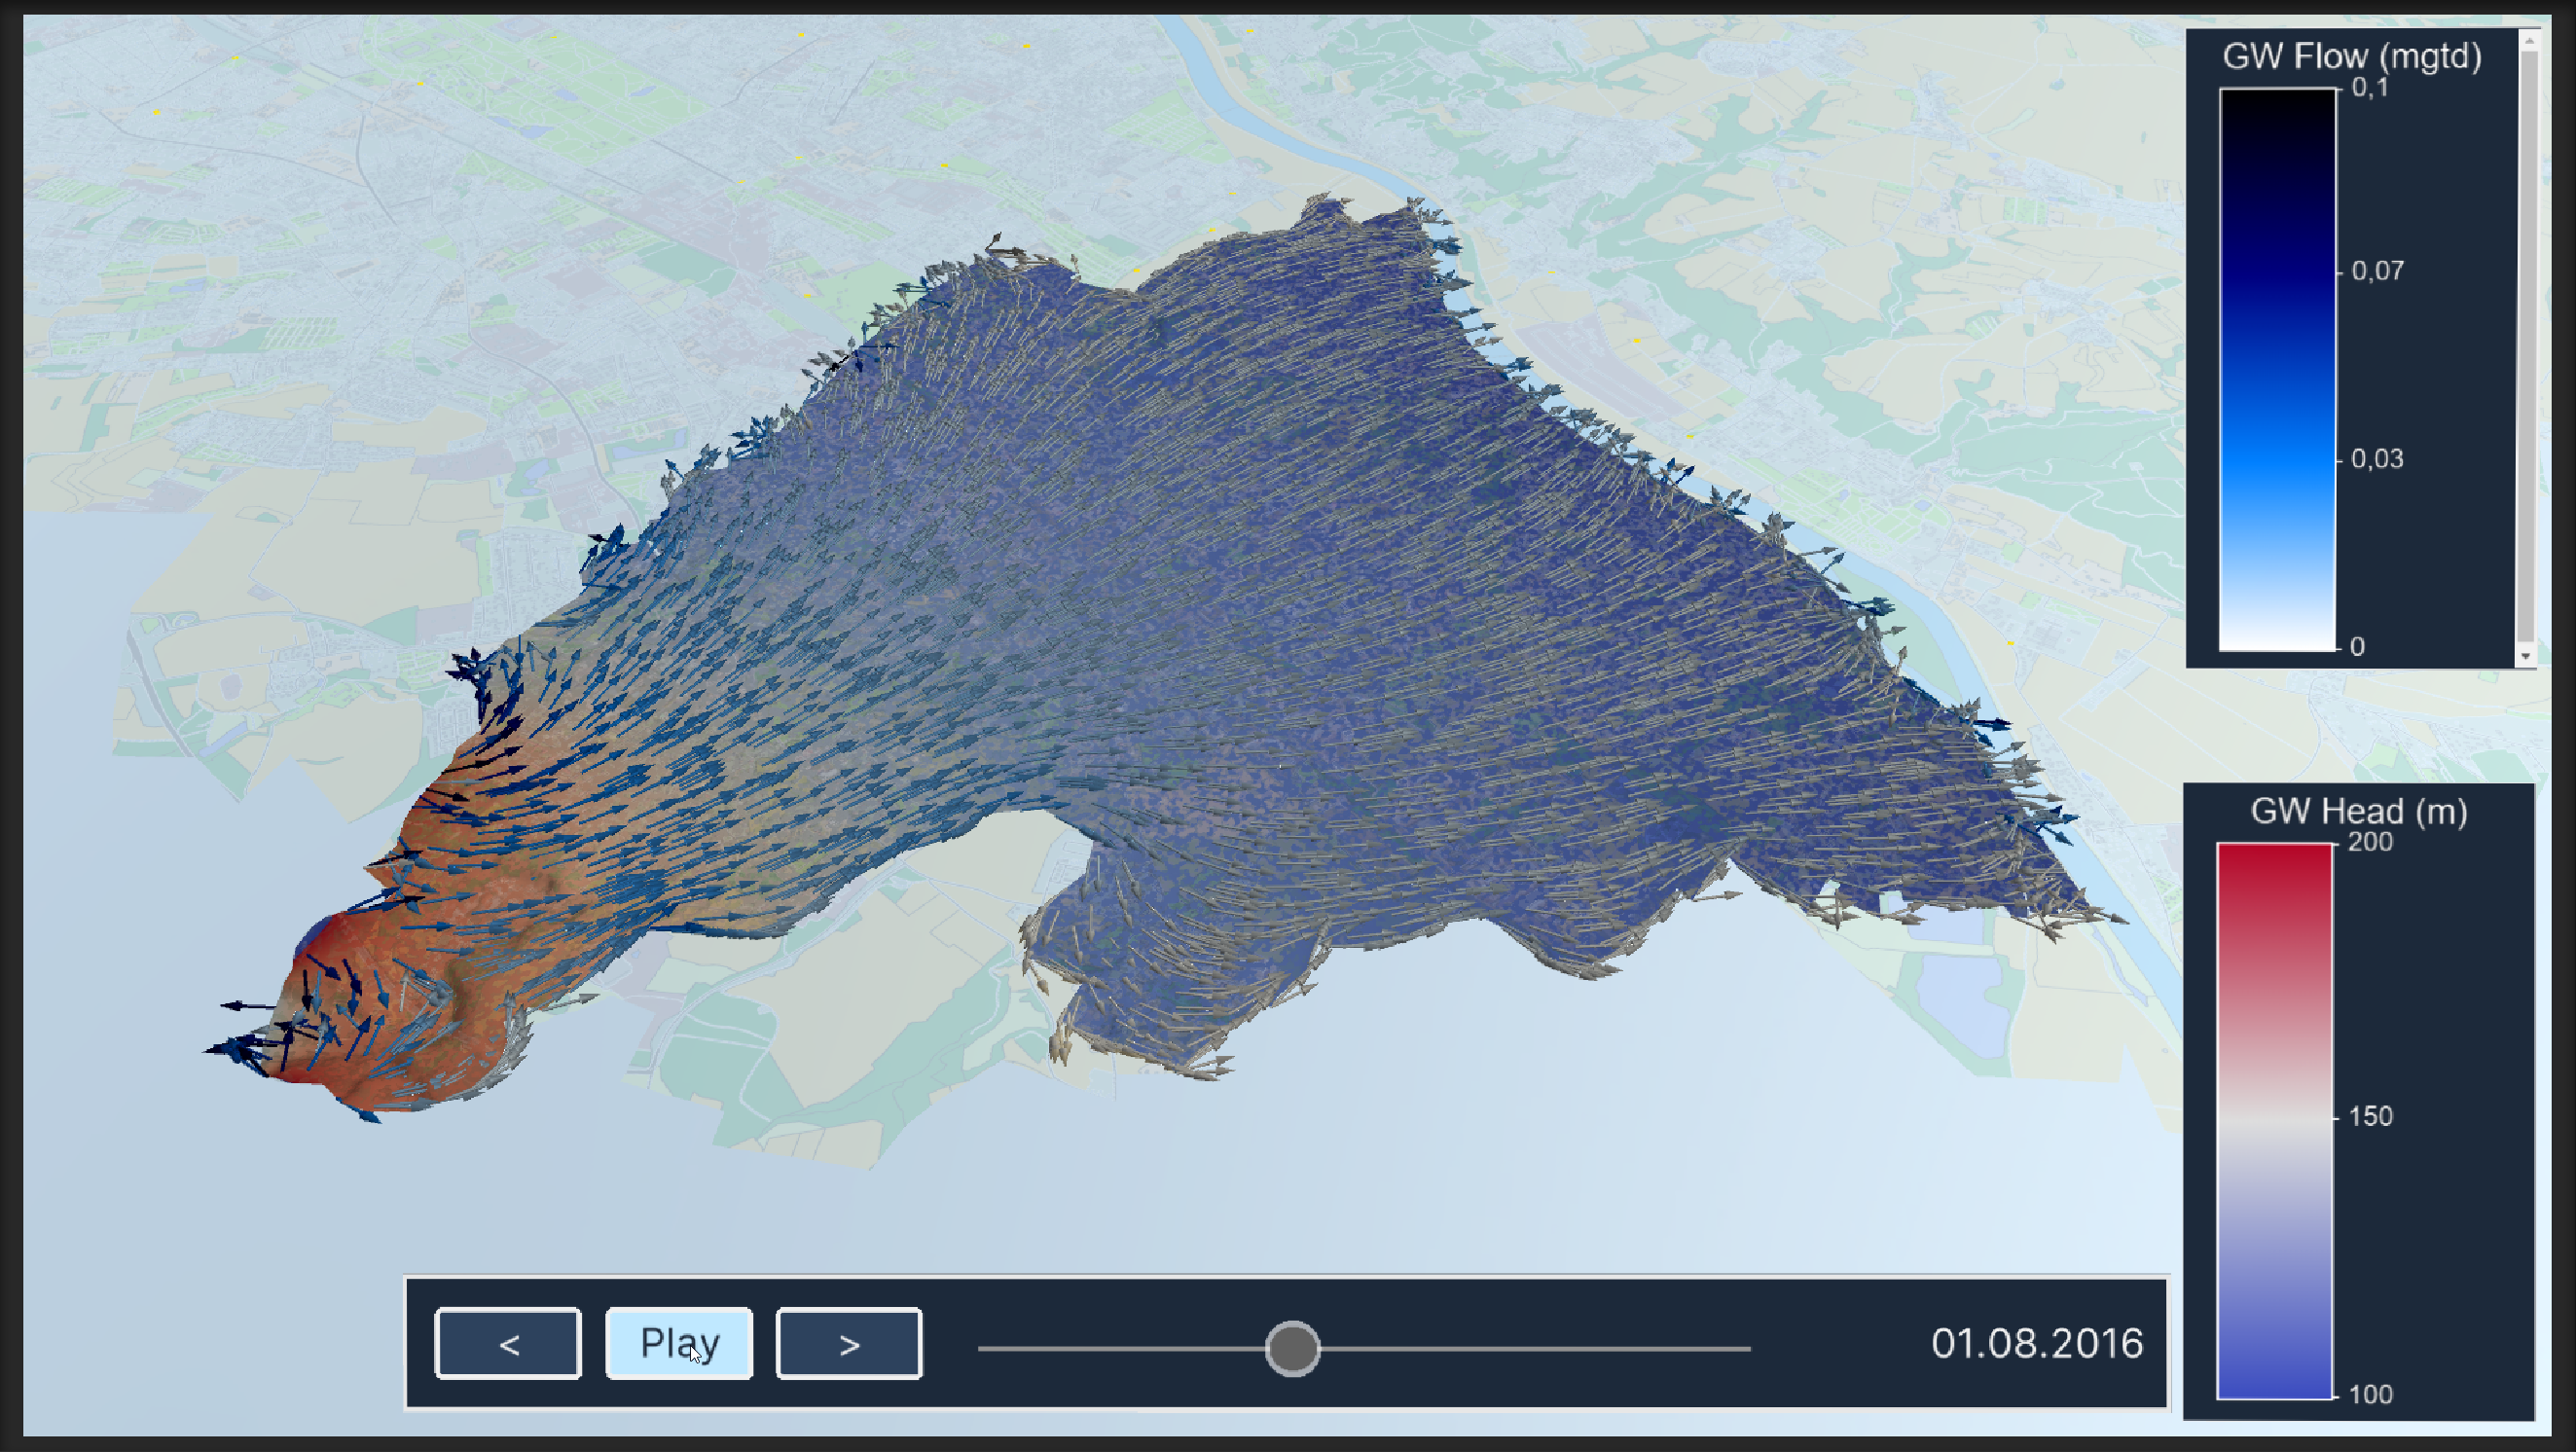
Hydrosystems
Studies focussing on hydrological or hydrogeological process such as groundwater flow and -managment, groundwater/surface water interaction, lakes, and coastal systems.
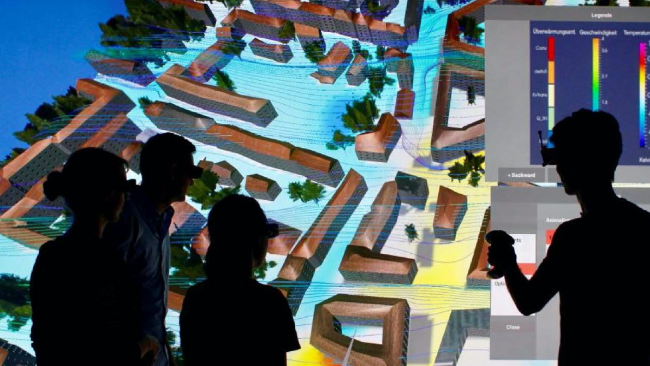
Urban Systems
Studies related to the resource management in urban areas, including energy infrastructures, energy storage, or sewage systems.
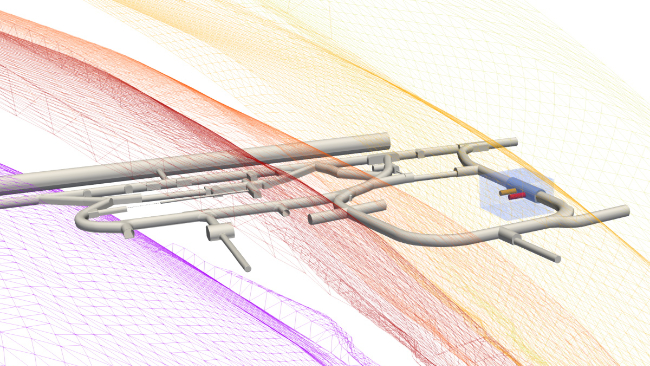
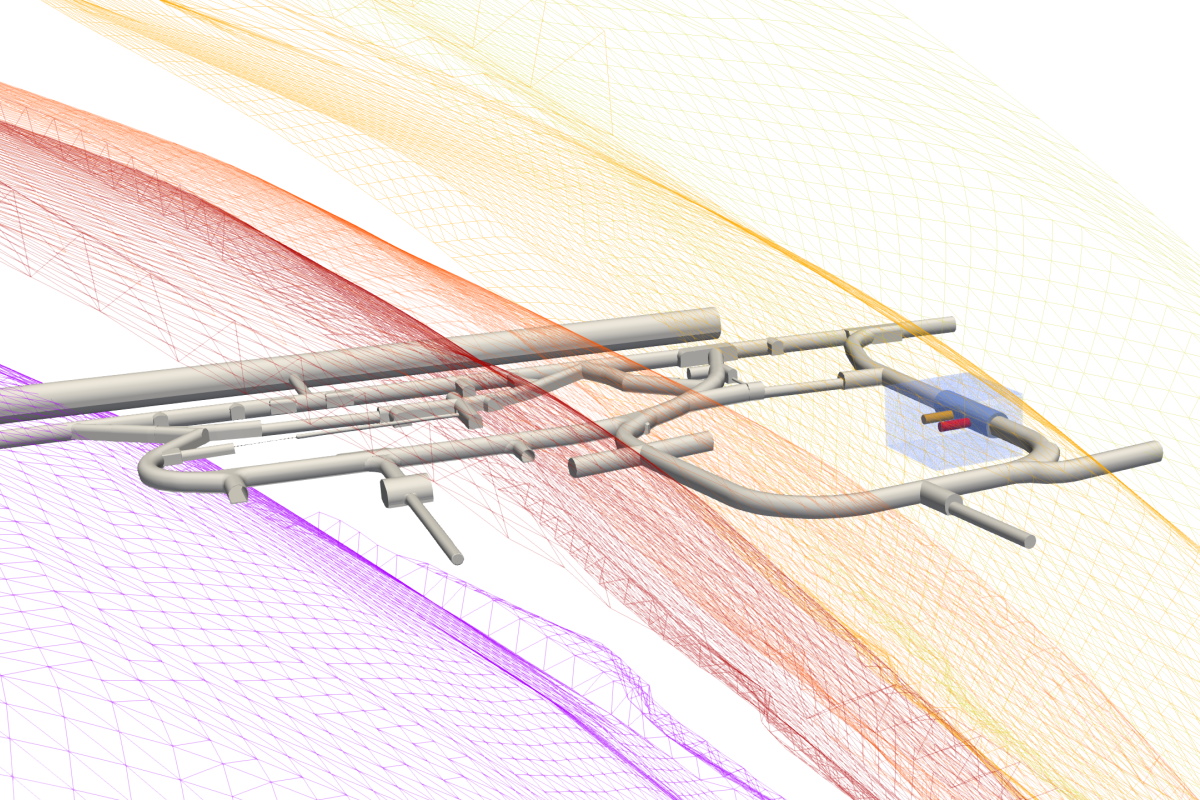
Energy & Geotechnics
Geotechnical studies with a wide range of applications in energy storage, waste management as well as deep and shallow geothermal systems.
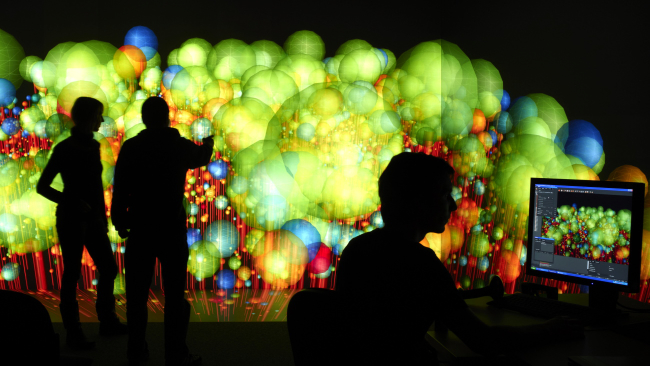
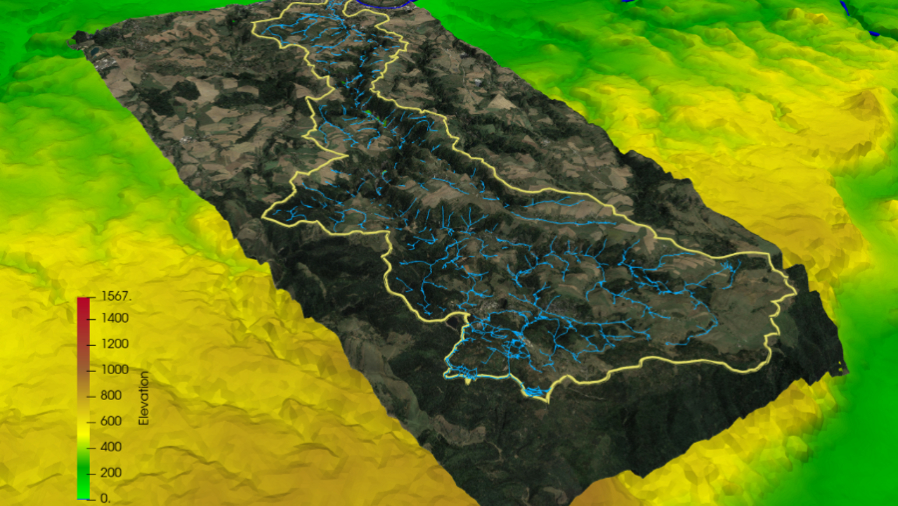
Climate & Eco Systems
Applications focussing of weather, climate and biodiversity simulations, including the visualisation of extreme weather events, forest growth, or urban micro climates.
Data Integration
Adjusting heterogeneous data sets to fit into a unified geographic context, is an essential step for subsequent tasks such as setting up numerical models or preparing scientific visualisation studies.
See our workflows for data integrationThe Team
The Data Integration and Visualisation Group is led by Karsten Rink and consists of members with different research interests that complement each other when working on complex data processing and visualisation projects.

Karsten Rink

Lars Bilke

Özgür Ozan Şen

Anna Chochyieva

Felix Raith

Susann Goldstein

Markus Jahn
Get to know the team
The Way We Work
Our projects are from a wide range of applications. Therefore, we are working in close collaboration with domain scientists providing data to get an idea of their research and to discuss their aims. With this information in mind, the multidisciplinary team of domain scientists and visualisation experts create the visualisation. In this way, we assure that the result of our work is useful for researchers to gain further insight into their data or to communicate their work to stakeholders or the public.
Publications
Modellbasiertes Management von Wasserextremen in urbanen Regionen
in Wasserwirtschaft, Wassertechnik wwt
EASyQuart - Energieeffiziente Auslegung und Planung dezentraler Versorgungsnetze von Stadtquartieren. Heizen und Kühlen unter Nutzung oberflächennaher geologischer Ressourcen
A visual-scenario-based environmental analysis approach to the model-based management of water extremes in urban regions
in Proceedings of Workshop on Visualisation in Environmental Sciences (EnvirVis) (2023)
Digitalisation for nuclear waste management: predisposal and disposal
in Environmental Earth Sciences
Hydro-mechanical Effects and cracking in opalinus clay
in SpringerBriefs in Earth System Sciences