Data Integration
at the Data Integration and Visualisation Group
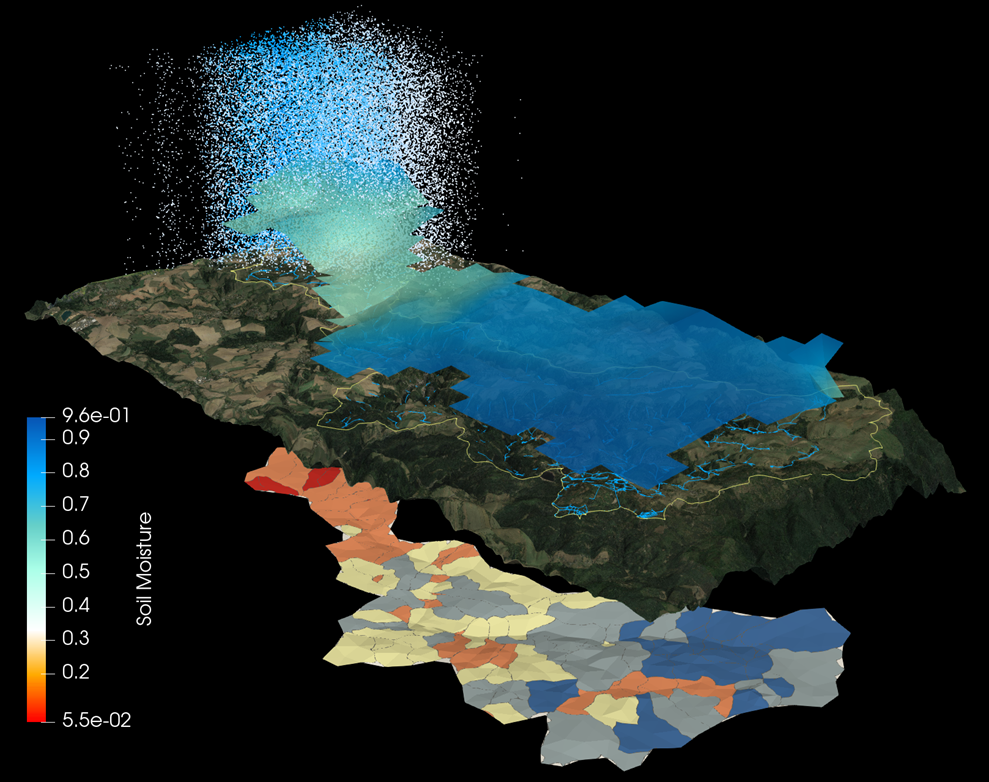
Data integration describes the modification of heterogenous data sets to fit into a unified context. This is a required step for complex workflows dealing with these datasets, such as the concurrent visualisation for knowledge transfer or gaining insight into complex interrelations between these datasets. It is also a necessary step for the generation of numerical models for a subsequent simulation.

Specifically for environmental studies, a large number of datasets from different sources and acquired by different measurement devices if often required to understand complex processes or phenomena within a region of interest. Examples include
- raster data, such as satellite data, maps, or seismic data
- vector data, such as river networks, streets, or boundaries
- triangulated or gridded data such as geological layers or 3d building models
- time series data from weather stations, gauging stations, or data loggers in general
- simulation results from numerical modelling software
All of these data sets differ fundamentally in file size, structure, resolution, and extent. Data sets can range from fairly simple (e.g. time series data from weather stations or withdrawal rates from wells) to quite complex (e.g. rain radar data over time or 3D models of geological structures). There are no general software products available that can deal with all of these types of data. Established systems such as QGIS can deal with a variety of 2D geographic datasets, while the visualisation framework ParaView is particularly suited for displaying 3D objects, vector fields, or other data from engineering domains.

Therefore, we have developed the OGS Data Explorer within the scope of the OpenGeoSys-initiative. As a part of the OpenGeoSys (OGS) simulation framework, the Data Explorer is a graphical user interface for the import, conversion, pre- and postprocessing of environmental data. It allows the mapping of datasets onto one another, the removal of certain types of artifacts, transforming and analysing the data, and much more. Together with a number of compatible command line tools it can be used to build modular and generalisable workflows for complex data processing tasks.
Publications
- K Rink, L Bilke, and O Kolditz (2014). “Visualisation Strategies for Envi- ronmental Modelling Data”. In: Env Earth Sci 72 (10), pp. 3857–3868. DOI:10.1007/s12665-013-2970-2
- K Rink, C Chen, L Bilke, et al. (2018). “Virtual geographic environments for water pollution control”. In: Int J Dig Earth 11 (4), pp. 397–407. DOI:10.1080/17538947.2016.1265016
- K Rink, E Nixdorf, C Zhou, et al. (2020). “A Virtual Geographic Environment for Multi-Compartment Water and Solute Dynamics in Large Catchments”. In: J Hydrol 582, art. 124507. DOI:10.1016/j.jhydrol.2019.124507